I’m a trained statistician. I worked on a motorcycle manufacturing shop floor for 3 years of my early career, and compared to tech companies, that was hell. However, the lessons I learnt there have moulded me forever.
The most important lessons revolved around a statistical quality tool called control charts or Shewart charts, named after Walter A. Shewart, who pioneered them. Shewart’s name is spoken in the same tones as that of Deming, who is responsible for the 14 Principles of Management.
What Are Control Charts?
A control chart, in its multiple forms, monitors a process for changes in a specific parameter, designated as the control parameter. This parameter helps us measure a desired outcome of a process. If a factory wishes to produce a shaft of diameter 25mm with a tolerance of 1mm on either side, then they should strive to make shafts from 24-26mm in size. While that’s a worthwhile exercise, it’s better to further limit the manufacturing process so that while the process sticks to the design requirements, it is also consistent within itself. This doesn’t mean you’re striving for a better design tolerance, but it speaks about whether your process even allows for better tolerances.
The control chart is a line plot that measures this parameter, or a statistic associated with it such as the average of a couple of readings taken at consistent timestamps. Control charts are divided into 2 areas, a portion of the chart is above a line called the control limit (CL), and the range of values is bounded on either side by an Upper Control Limit (UCL), and a Lower Control Limit (LCL), which tell us how much our process is capable of fluctuating.
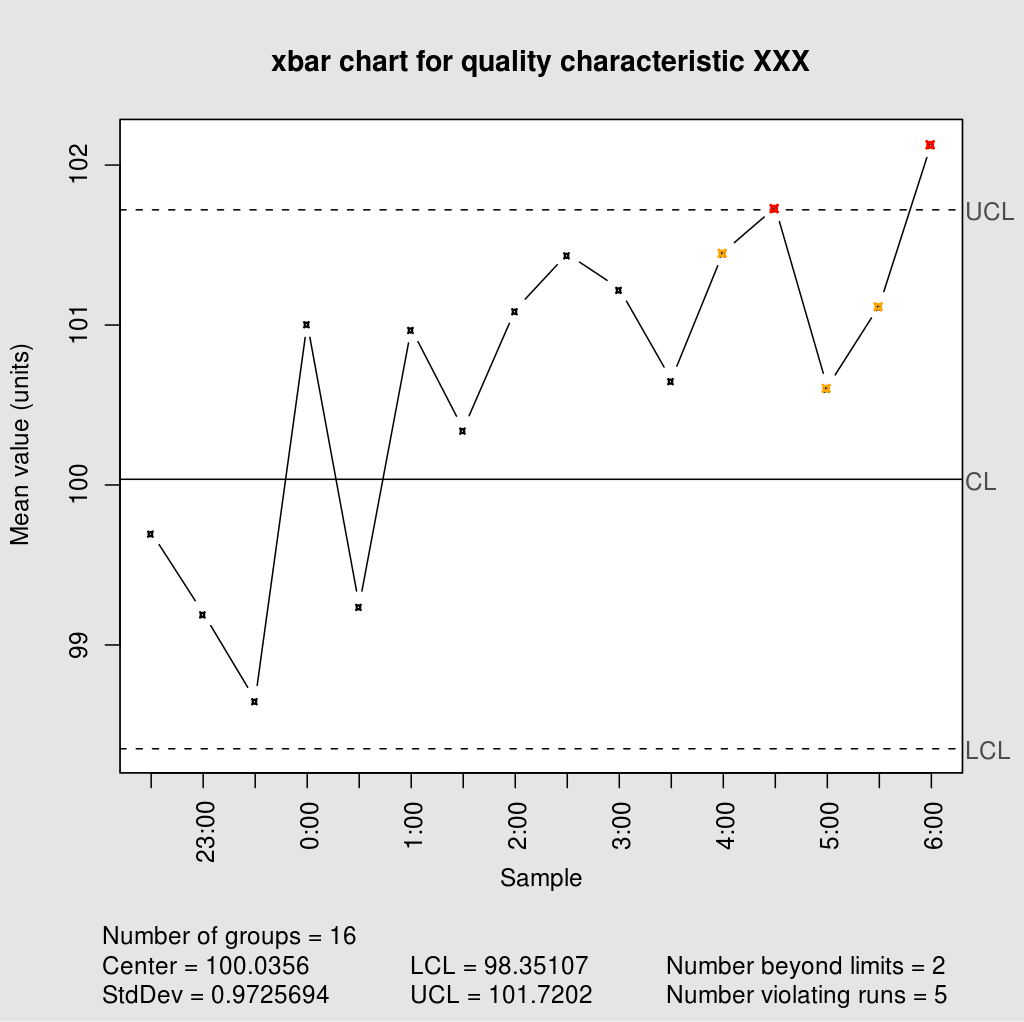
A sample control chart, marking the limits and showing how a process is slowly deviation from its control limits.
These limits aren’t decided by us. Indeed, they have nothing to do with the tolerances that the design engineer has set. Instead, they have everything to do with the statistical limits of your process. That means that the last 25 readings you take in your process decide the UCL, CL and LCL for the next couple of readings.
Interpreting Control Charts
If 7 consecutive readings on a control chart fall on one side of the limits, that’s your chart telling you that you have serious problems. Your process is slowly deviating to one side of your limits. It doesn’t need to be negative by the way. Perhaps you want your process to shift in one direction. This is an indication that whatever you’re doing to your process is shifting the metric to one side.
These shifts are predicatable, and they also indicate a shift in your process that could arise from inherent causes. However, there are sudden shifts that could happen because of uncontrollable causes. These problems will not cause long-lasting errors in your readings, and they’re usually the sort that need a lot of brain-wracking to solve immediately. If they’re not addressed immediately, this will indicate that something is really wrong with your process management, and not really reflect whether your process is doing well or now.
Applications Beyond Manufacturing
While a control chart is something you can definitely use in technology companies – in fact, control charts are strongly associated with LEAN manufacturing, but I’m not experienced enough at Software applications in LEAN to say whether these are actually used in a tech company – the principles behind control charts extend far beyond manufacturing processes.
The core insight is that any process has inherent variation, and understanding that variation helps you distinguish between normal fluctuations and meaningful changes that require intervention. This thinking can be applied to software metrics, team performance, and even career decisions.
References
These are a list of books I love recommending if you’re interested in the topic of statistics and process control:
- Edward Deming - Out of the Crisis
- Walter A. Shewart - Statistical Method From the Viewpoint of Quality Control
- Taiichi Ohno - Toyota Production System: Beyond Large-Scale Production
- Taiichi Ohno - Workplace Management
These books were written in a time where statistical quality control was applied predominantly to manufacturing processes, but I’d recommend looking at them through the lens of a general engineer, as opposed to a software engineer. If you ever find yourself wanting to discuss these topics, I’m always available.